Lactate Vs Power to Determine Threshold
Below is a collaborative piece based on an ongoing project between Silver Sage Sports and Fitness Lab and the developers of TrainerRoad software. We wanted to see how deriving threshold via lactate and power compared, contrasted and ultimately how the numbers stacked up.
Recently, Chad and Reid from TrainerRoad performed lactate tests at Silver Sage Sports and Fitness Lab. All of our TrainerRoad workouts are based upon Functional Threshold Power. While this value is ideal for power-based training, we wanted to dive in deeper and explore this value a bit more. What causes it? What can we learn from it? What does it really mean? While many things may factor into these answers, one of the biggest is lactate.
Lactate is the cause behind your pain when you’re grinding away at or above FTP. It is an acidic substance produced by skeletal muscles when they are no longer operating aerobically. It’s a very common product of endurance exercise, but when you’re really pushing your limits, the accumulation of lactate in your body is what forces you to slow down and fatigue.
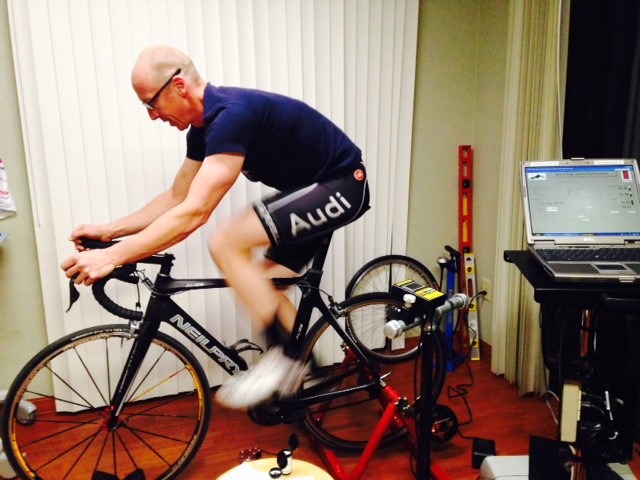
To begin our experiment, we had both guys undergo a lactate threshold test in the lab. The first step was an EKG. After that came back normal they hopped on the bikes which were on a Computrainer for a 10 minute warmup.
The test was a ramp test which was conducted as follows:
- Start at 60 watts
- Increase by 40 watts every 4 minutes
- Measure blood lactate, heart rate, and RPE at the end of each segment
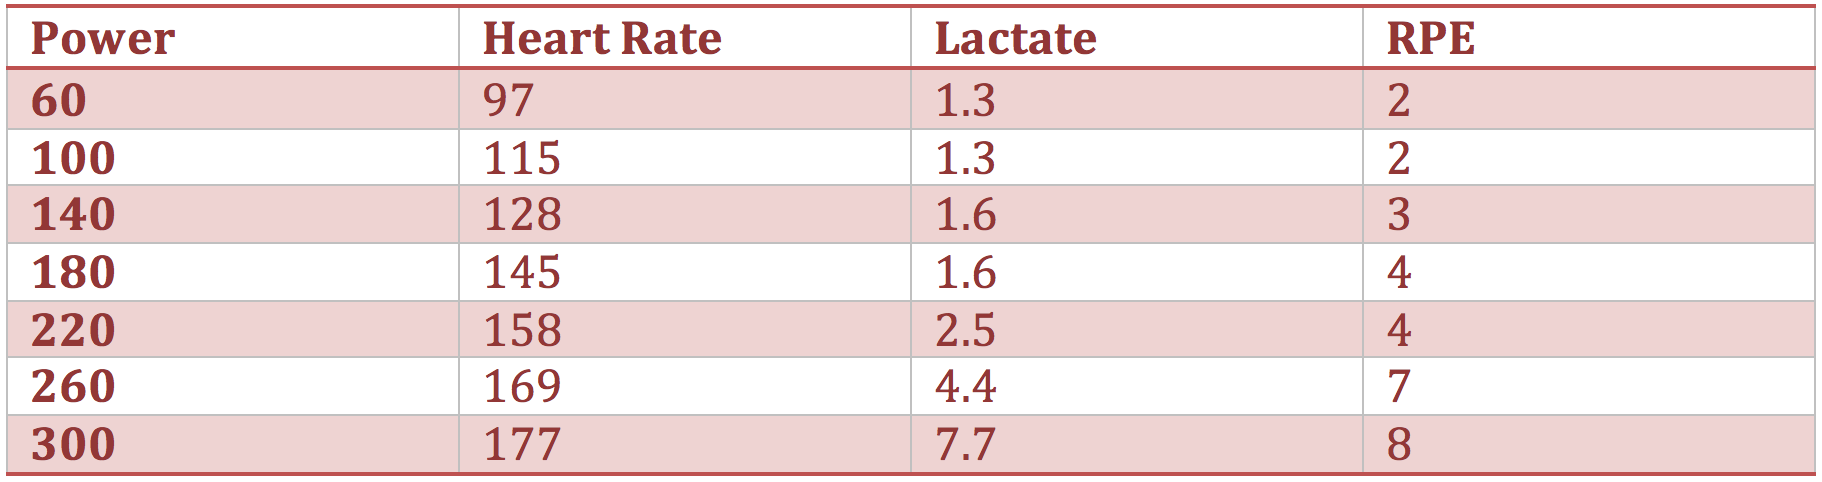
Blood lactate measurements were done via a prick on the ear and the results were as followed:
Reid
![]()
Chad
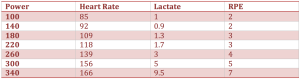
Lactate Threshold Heart Rate
Looking at the data, there’s a couple interesting things that stand out. The first is in regards to heart rate. You can test LTHR using TrainerRoad, which sometime leads to confusion due to the uniqueness and plethora of variables that affect this value from athlete to athlete.
In this case, we see that Reid reached a significantly higher max heart rate despite putting out less power. While this can be attributed to many things, including current fitness level, recovery, amount of sleep they got the night before, diet, etc. it’s important to remember that heart rate cannot be looked at like power. More watts are always good, but a higher heart rate does not mean more power. Even more, sometimes LTHR can decrease as you go through a training plan and become more fit, even though FTP is increasing.
Muscle Types
Another interesting thing the lab test pointed out was in regards to the types of muscle fibers both Reid and Chad have. As endurance athletes, it’s safe to say both of them have a good amount of slow twitch fibers. These are the red, oxygen-dense muscle fibers that function aerobically.
However, notice how high Chad’s lactate shot up once he reached threshold. This large and rapid accumulation shows that he has a great deal of fast twitch fibers as well. These are white, anaerobic fibers that are utilized for things like weight lifting or sprinting. These fibers are also big lactate producers, so as soon as Chad went anaerobic with his effort, these fibers were recruited and the large lactate value we see here was produced.
By understanding this, both Reid and Chad can gear their training and racing to their strengths. For example, these results would lead us to believe that Chad has a pretty mean sprint and ability to really bury himself with an effort much over his FTP. However, due to his amount of fast twitch muscle fibers, if he were to jump right into an ultra-endurance event, he may struggle due to the extra lactate that his body has to remove from his muscles. In order to prepare for an event like this, he’d need to spend a lot of time training in Zone 2 in order to adapt and convert more muscles to slow twitch.
FTP Testing
Just a few days after the lab testing, both guys jumped on TrainerRoad to do a standard FTP test to compare and contrast the results. While the lab tests show where the curve regarding lactate production really starts turning upwards, indicating threshold, TR provides the exact number for FTP. For Both Reid and Chad, these numbers were right in the middle of the steepest part of the curve, indicating lactate is in fact the limiting factor.
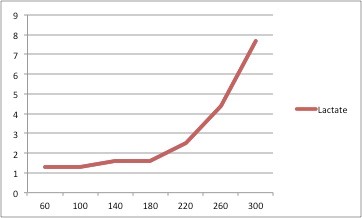
Reid’s plot shows the greatest slope at approx. 260 watts, and his FTP was 265.
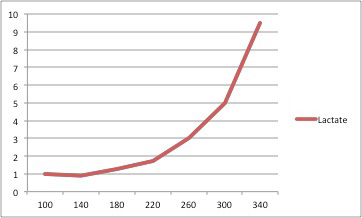
Chad’s graph shows the greatest slope at 315 watts and his FTP was 322.
In Conclusion
Perhaps the biggest thing we took away from the experiment, was that the FTP values were spot on with the laboratory-derived zones. However, actually seeing the physiology at work that was creating both Chad and Reid’s FTP’s was fascinating. Seeing the lactate accumulate provided an additional layer of insight into each athlete’s fitness, something that a single numerical value (FTP) cannot do. Beyond a definitive threshold number, lactate testing also provides
- A window in to the underlying metabolic systems and responses
- Data resulting in a lactate slope that provides clear indications of training effectiveness
- The ability to determine each athletes individual muscle-fiber make up and propensity for shorter explosive or longer endurance events
- A precise starting point for the threshold zone by indicating when the body is starting to accumulate lactate
- A clear ceiling of the pure aerobic zone
- A clear distinction where the aerobic zone ends and the threshold zone begins
The more you know and understand about your fitness, the better you can fine tune and perfect it.